Datei:Zhukovsky transform.svg

Originaldatei (SVG-Datei, Basisgröße: 459 × 176 Pixel, Dateigröße: 17 KB)
![]()
Diese Datei und die Informationen unter dem roten Trennstrich werden aus dem zentralen Medienarchiv Wikimedia Commons eingebunden.
![]()
Beschreibung
| Beschreibung |
English: Airfoil from Zhukovsky transform with explaining plot of used parameters.
Deutsch: Ein Strömungsprofil nach Schukowski Transformation mit erklärender Grafik der verwendeten Parameter. |
| Datum | |
| Quelle | Eigenes Werk |
| Urheber | Karsten Adam (Diskussion) |
Beschreibung
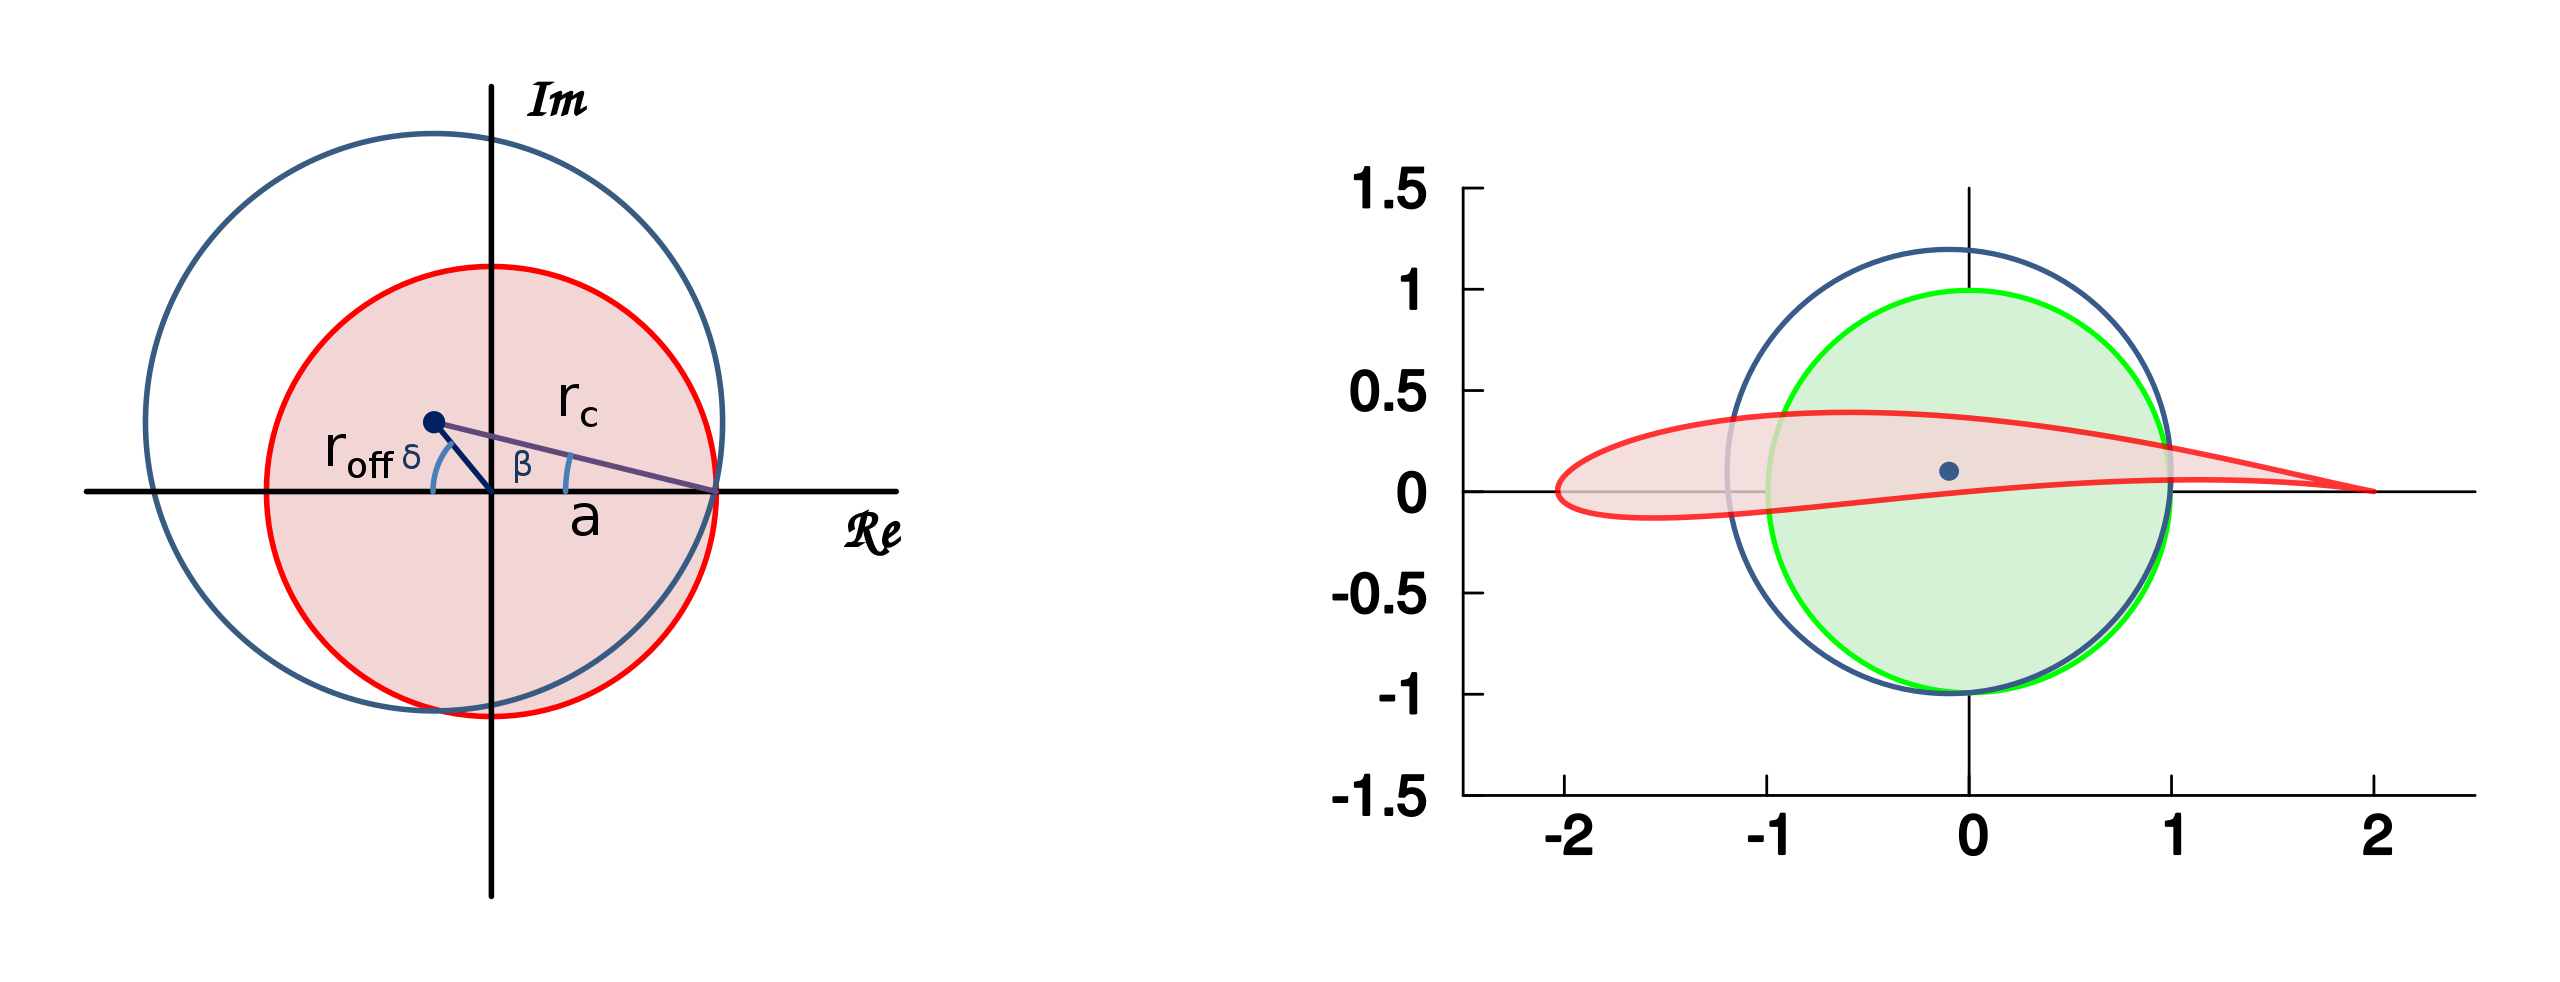
The Zhukovsky transform is given by

Where a is the radius of the reference circle centred at the origin.
The unit circle is a special case giving a flat rectangle on the real axisof length 2. The circle which transforms to the aerfoil shape is defined as shown in the left subplot. To get an instructive airfoil the reference circle has to be moved out of the origin. This offset is written in polar coordinates as the distance from origin and the angle measured clockwise from the negative real axis. The radius is measured from the offset point to . The circle which transforms to the airfoil shape is given by:


The radius of the circle, , which transforms to the airfoil shape, is given by:

The reference angle, β, is given by:

So there are three parameters for the plots above:
- , the radius of the reference circle at origin
- , the distance from origin to center of offset circle
- , the angle clockwise from negative real axis to center of offset circle

The left subplot is created with , and , the right subplot is based on , and .


Matlab/Octave represents curves as a (large) set of (short) straight lines, thus leading to a large number of graphic primitives in SVG, inflating the file size. To reduce this file size, some of the curved lines (the circles) are replaced by native graphic primitives with Inkscape.
After runing the code some more tweaking and optimization on the resulting SVG file took place with Inkscape and other editors.
Source code
To create such plot type in Octave
% global setting of whole figure
f = figure;
set(f, 'Position', [0, 0, 1024, 768]);

%-----------------------------------
% left subplot, explaining variables
%-----------------------------------
subplot(1,2,1)

% settings of Zhukovsky transform
a = 1;					% radius of reference circle (here: unit circle)
delta = 0.28*pi;			% angle clockwise from negative x axis to center offset
roff = 0.4;				% length of offset vector

% circle to be transformed, calculate parameters
roffvec = roff * (cos(pi - delta) + i * sin(pi -delta));	% center offset as vector
rx = real(roffvec);			% center offset x coordinate
ry = imag(roffvec);			% center offset y coordinate
rc = abs(a - roffvec)			% length of radius of circle to be transformed

% plot main objects
% unit circle, coded as rounded (square) rectangle
rectangle('Position', [-a -a 2*a 2*a], 'Curvature', [1 1], 'EdgeColor','r', 'FaceColor', [.95 .84 .84])
% circle to be transformed, coded as rounded (square) rectangle
rectangle('Position', [(rx-rc) (ry-rc) (2*rc) (2*rc)], 'Curvature', [1 1], 'EdgeColor',[.22 .36 .54])
% line from origin to center offset
line([rx, 0], [ry, 0])			% r offset
% line from center offset to perimeter at a+0*i
line([rx, a], [ry, 0])			% radius of circle to transform
text('Position', [0.5 0.4], 'String', 'rc' )	% example of annotation

% axis settings and additional axis lines
axis("equal");
set(gca,'box','off','xtick',[],'xcolor','w','ytick',[],'ycolor','w')
axismax = 1.8;
line([-axismax, axismax], [0, 0])    		% x axis
line([0, 0], [-axismax, axismax])		% y axis

%---------------------------------------------------
% right subplot: 2 circles and the airfoil transform
%---------------------------------------------------
subplot(1,2,2)

% settings of Zhukovsky transform
a = 1;					% radius of reference circle (here: unit circle)
delta = pi/4;				% angle of offset vector: 45 degree clockwise from negative x axis
roff = 0.14;				% length of offset vector

% circle to be transformed, calculate parameters
roffvec = roff * (cos(pi - delta) + i * sin(pi -delta));	% center offset as vector
rx = real(roffvec);			% center offset x coordinate
ry = imag(roffvec);			% center offset y coordinate
rc = abs(a - roffvec)			% length of radius of circle to be transformed

%-----------------------------------------------
% this is where the transformation magic happens
%-----------------------------------------------
theta = 0:.01:2*pi;			% argument angle in circle to be transformed: array from 0 to 2*pi step by 0.01
zeta = rc .* exp(i.*theta) + roffvec	% circle as set of complex numbers
x = real(zeta + a^2./zeta)
y = imag(zeta + a^2./zeta)

% plot main objects
% reference (unit) circle, coded as rounded (square) rectangle
rectangle('Position', [-a -a 2*a 2*a], 'Curvature', [1 1], 'EdgeColor','g')  %, 'FaceColor', [.95 .84 .84])
% circle to be Zhukovsky transformed, coded as rounded (square) rectangle
rectangle('Position', [(rx-rc) (ry-rc) (2*rc) (2*rc)], 'Curvature', [1 1], 'EdgeColor',[.22 .36 .54])
hold on;				% force more graphics to be plotted in same subplot
% mark center offset with a dot
plot(real(roffvec),imag(roffvec),'Color',[.22 .36 .54])
hold on;				% force more graphics to be plotted in same subplot
% this is the airofoil, the target plot of Zhukovsky transform
plot(x,y,'Color','r')

% axis settings and additional axis lines
xmax = 2.5;
ymax = 1.5;
axis([-xmax, xmax,-ymax, ymax], "equal")
line([-xmax, xmax], [0, 0])    % x axis
line([0, 0], [-ymax, ymax])	% y axis

% output plots to file
%print -dpng airfoil.png  % uncomment this to get a PNG directly
print -dsvg airfoil.svg
Lizenz

|
Es ist erlaubt, die Datei unter den Bedingungen der GNU-Lizenz für freie Dokumentation, Version 1.2 oder einer späteren Version, veröffentlicht von der Free Software Foundation, zu kopieren, zu verbreiten und/oder zu modifizieren; es gibt keine unveränderlichen Abschnitte, keinen vorderen und keinen hinteren Umschlagtext.
Der vollständige Text der Lizenz ist im Kapitel GNU-Lizenz für freie Dokumentation verfügbar. |
- Dieses Werk darf von dir
- verbreitet werden – vervielfältigt, verbreitet und öffentlich zugänglich gemacht werden
- neu zusammengestellt werden – abgewandelt und bearbeitet werden
- Zu den folgenden Bedingungen:
- Namensnennung – Du musst angemessene Urheber- und Rechteangaben machen, einen Link zur Lizenz beifügen und angeben, ob Änderungen vorgenommen wurden. Diese Angaben dürfen in jeder angemessenen Art und Weise gemacht werden, allerdings nicht so, dass der Eindruck entsteht, der Lizenzgeber unterstütze gerade dich oder deine Nutzung besonders.
- Weitergabe unter gleichen Bedingungen – Wenn du das Material wiedermischst, transformierst oder darauf aufbaust, musst du deine Beiträge unter der gleichen oder einer kompatiblen Lizenz wie das Original verbreiten.
Dateiversionen
Klicke auf einen Zeitpunkt, um diese Version zu laden.
| Version vom | Vorschaubild | Maße | Benutzer | Kommentar | |
|---|---|---|---|---|---|
| aktuell | 19:23, 4. Jun. 2014 | 459 × 176 (17 KB) | Karsten Adam | {{Information |Description ={{en|1=Airfoil from Zhukovsky transform with explaining plot of used parameters.}} {{de|1=Ein Strömungsprofil nach Schukowski Transformation mit erklärender Grafik der verwendeten Parameter.}} |Source ={{own}} |... |
Dateiverwendung
Die folgenden 2 Seiten verwenden diese Datei: